
Bots are a nuisance that corrupt data and skew market research results. They are increasingly sophisticated and sneaky, so we have become increasingly vigilant.
We have been aggressively fighting bots for years, but in the past year we reviewed and revamped our bot detection efforts. We are now seeing cleaner, more reliable data. That, in turn, leads to more valuable and actionable insights for our clients.
.png?width=735&height=368&name=The%20Olinger%20Group%20Blogs_800x450%20(1200%20%C3%97%20600%20px).png)
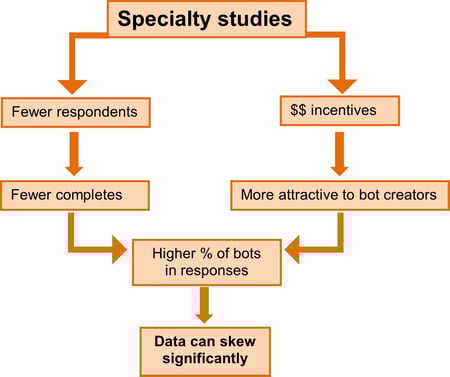
While bots are an issue for any type of survey, they are especially problematic when we recruit for specialty studies like B2B or healthcare.
Traditional approach
Every market research firm and panel company knows that bots exist. With adequate data quality and control measures, we can make it easier to detect and remove them.
At The Olinger Group, we target bots from all the traditional angles.
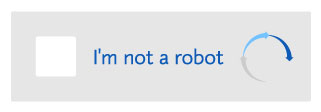
- We attack bots from the front end with captchas, a.k.a. clickable “I’m not a robot” boxes or “Pick which of these pictures have streetlights” type prompts.
- We attack bots from within by adding trick questions to our surveys. That might look like, “Select option C for this question” or “Tell us your favorite flavor of ice cream.”
- We also attack bots at the back end by looking for speeders, cheaters, and straight-liners. Basically, anyone (or anything) that zips through the survey or makes predictable patterns with their answers.
Each of those attacks is important, and they enable us to weed out 10% - 12% of the responses in a panel survey. However, we had a strong suspicion there were more bots getting through undetected. As technology became more sophisticated, our methods became more sophisticated.
New perspective
Instead of assuming that our traditional methods of attack give us basically clean data with a few bots, we began assuming that every survey response is a bot until proven human. This paradigm shift in how we view responses allows us to assess the bot risk of each respondent more critically.
In addition to the traditional approach, we now do the following as part of our risk assessment:
- Set strict limits for numeric responses.
- Example: 23 people in one household (Nope – that’s likely a bot response.)
- Look for consistency between answers.
- Example: Did the respondent really take 15 vacations but only spent $500 on travel in the past two years? (Highly doubtful – goodbye bot.)
- Look for consistency in open-ended questions.
- Example: Did the respondent give the same or conflicting responses to every question? (This doesn’t just include gibberish responses; we also flag respondents that give a lot of “no comment” or “it’s good” responses.)
- Look for consistency from respondent to respondent.
- Example: I recently cleaned a study and had to remove five respondents because nearly every answer throughout the entire survey was the same – even open-ends. (Not statistically probable.)
Results
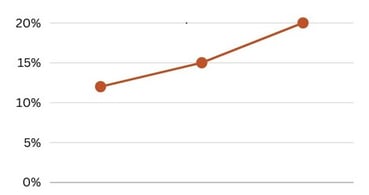
I am happy (or sad?) to say that we were right. There are definitely more bots sneaking past the traditional tests. But we are catching a lot of them with our new perspective and increased scrutiny. In fact, our bot detection rate rose from 12% to around 20% of “respondents.”
Bots will always exist and evolve, and we will always have to fight them through improved strategies. At The Olinger Group, we are committed to helping brands that help others live well. One way we do that is by working hard to keep the data as clean as possible, so that our clients get the insights they need to do what they do best.
If you liked this or any other blog we've written, feel free to comment below and don't forget to subscribe to our blog so you'll be notified each time we post.